
Michael Wolfe contributed to this article
At Accion Venture Lab, we seek out fintech solutions that provide access to those who have historically been excluded from – or underserved by the global financial system. It’s why we’ve given more attention to solutions that place finance closer to the point of transaction, within a customer’s existing way of living, working, or doing. This approach has come to be colloquially known as embedded finance.
One of the most promising pathways to introducing financial services to more people is by layering them on top of software platforms that aim to digitize and improve existing ways of working within specific industries. We’ve seen an emerging wave of software solutions tailored to historically analog industries with fragmented suppliers, partners, and customers – many of whom are small businesses historically lacking access to financial services. Whether it’s construction companies managing their subcontractors or trucking fleets managing dispatch services, nearly every industry is digitizing and optimizing. Verticalized software as a service (vSaaS) is uniquely well suited to deliver customized financial services, with transactional data as the backbone to creating more accessible, affordable, and timely financial products – while also providing the benefit of improving each industry’s way of working.
Given vSaaS’ role in embedded finance, we wanted to explore the characteristics of what makes such a platform succeed. We examined our own portfolio of companies in this space, as well as talked with a variety of experts, including later stage investors, to understand how other verticalized solutions have succeeded. We identified several core metrics central to evaluating these companies and uncovered tactics that successful platforms have used in the past to improve those metrics. We’re excited to now share what we’ve learned.
In the first post of this two-part series, we’ll discuss the metrics that matter — the five core metrics, along with benchmarks, that investors use to dive into a vSaaS company’s ability to win.
What are the metrics that matter?
There’s an all-important first question in the mind of a SaaS-oriented investor: Is the market large enough? Verticalized SaaS models are designed to focus on a specific pain point within a specific industry; thus, they have a smaller addressable market, and the market size becomes a core factor for evaluation. Later-stage investors are primarily interested in vSaaS companies with a Total Addressable Market (TAM) of at least $1 billion and the potential for rapid growth. There are two different methods that investors will often use to measure TAM:
- Top-down TAM calculation: The TAM for a vSaaS company is determined by the total amount that companies within a specific vertical spend on products and services the vSaaS tends to replace (or optimize). For example, if the manufacturing vertical in a region generates $242 billion in annual revenue and allocates 0.5 percent of this revenue to accounting software, the TAM for vSaaS accounting software in that vertical would be approximately $1.2 billion. If the vSaaS also plans to offer fintech solutions, the TAM would include that vertical’s spend on financial services as well.
- Bottom-up calculation: Later-stage investors will often assess whether a vSaaS company can acquire sufficient market share of the TAM it aims to tackle to generate substantial annual revenues. For instance, if the vSaaS focuses solely on software, investors need to be convinced of its ability to grab sufficient market share to roughly $200- $300 million in annual revenues (which can vary depending on the software’s gross margins). The overall TAM size ($1.2 billion in our example) also puts a practical limit on future revenue potential of the vSaaS. For example, in a $500 million moderately growing market, it’s unlikely that a company will achieve $300 million in revenue, as that would require the company to acquire an unrealistic market share of 60 percent.
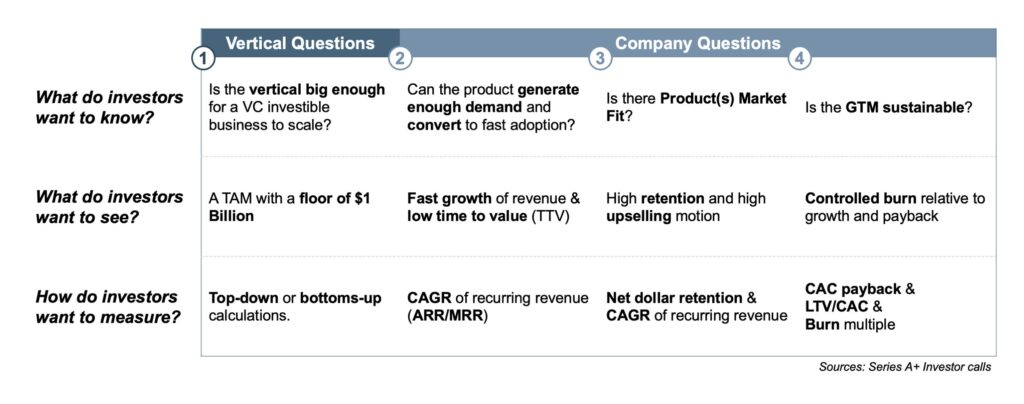
As shown in the above chart, investors also utilize several additional qualifiers on a company-specific level. Creating demand, driving usage and retention, and converting it to revenue sustainably, is a standard playbook that all venture-scale companies aim to achieve. For vSaaS companies, this playbook is measured by five key metrics.
Decoding vSaaS success metrics
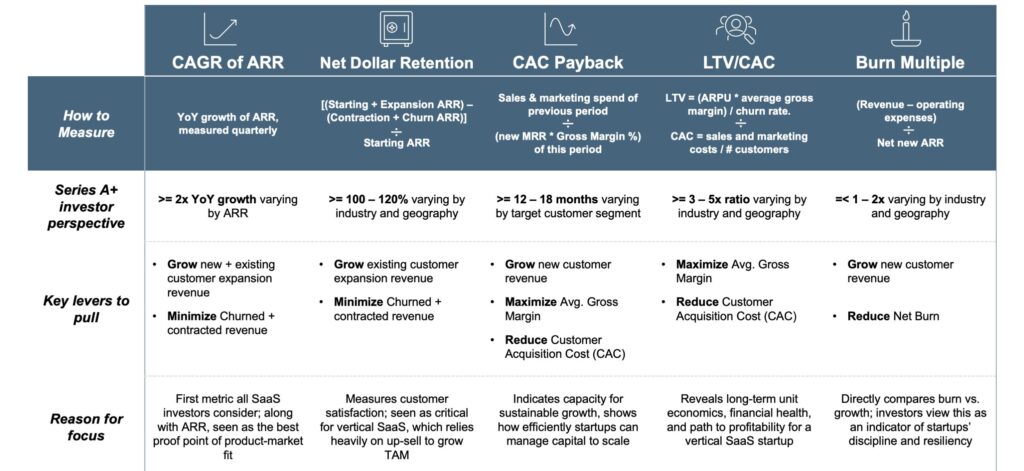
The five core metrics for success — Compound Annual Growth Rate (CAGR) of Annual Recurring Revenue (ARR), Net Dollar Retention (NDR), Customer Acquisition Cost (CAC) Payback Period, Lifetime Value (LTV) to Customer Acquisition Cost (CAC) Ratio, and Burn Multiple— provide crucial insights into a company’s performance, market traction, and financial health. By benchmarking against industry standards, implementing optimization strategies, and drawing inspiration from market examples, vSaaS companies can unlock their potential, attract investment, and chart a path toward long-term profitability and scalability.
We’ve combined our own experience investing in these models with insights from industry experts – including later-stage investors – to give a lens into each metric and the benchmark to aim for each. In part two of our blog series, we’ll share a bit more on the levers these companies can use to improve them.
1. Compound Annual Growth Rate (CAGR) of Annual Recurring Revenue (ARR)
What it is: The CAGR of ARR measures the annualized growth rate of a company’s recurring revenue. Typically measured on a quarter-by-quarter basis, it provides insights into the company’s sales engine, revenue trajectory, and ability to grow profitably in the future.
Why is it important? Investors want to see a pathway to profitability, and CAGR helps identify whether a product can capture revenue quickly. It helps ease investors’ minds about the product’s ability to build a deep moat, crowd other competitors out, and as eventually translate to profitability. Additionally, a rapid and sustained increase in paying customers is a strong indicator of product market fit (PMF).
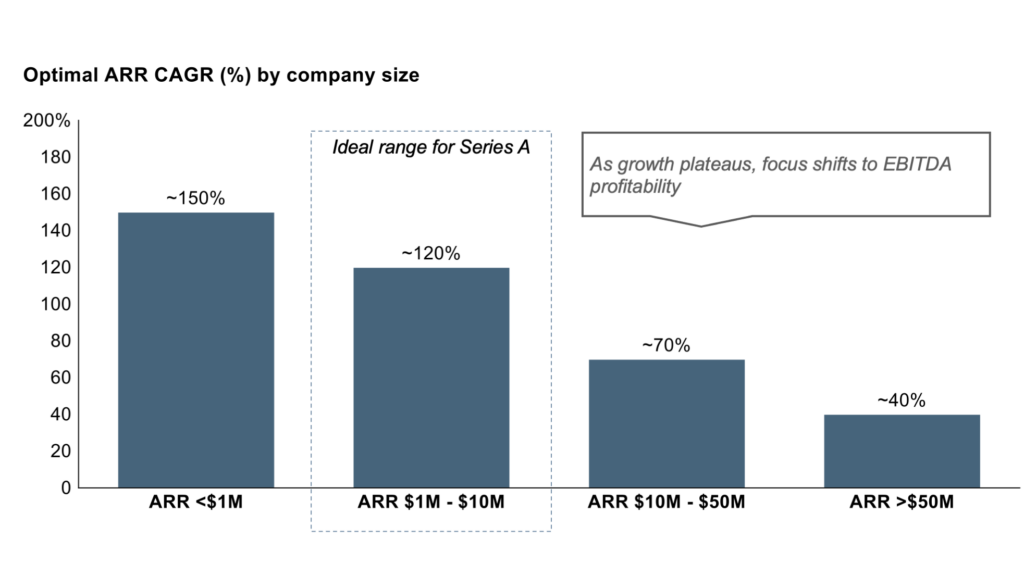
What’s good? From an early stage vSaaS company, investors typically seek a CAGR of ARR ranging upwards of 120 to 150 percent, as the “right” market should offer sufficient whitespace to grow rapidly. However, as ARR grows with scale, the market saturates, and hence, investors expect slightly lower CAGR as well, as seen in this chart below. At such stages, the business should shift its focus to economies of scale and deliver EBITDA profitability.
2. Net Dollar Retention (NDR)
What it is: NDR measures the revenue retention and expansion within a company’s existing customer base over a specific period, excluding the effects of new customer acquisition. The calculation accounts for all of these revenue metrics and is calculated as:
NDR = [(Starting ARR + Expansion ARR – Contraction ARR – Churn ARR)/ Starting ARR]*100
In the above equation, here’s what we mean by each ARR definition:
- Starting ARR: ARR that was realized in the previous period.
- Expansion ARR: The gain in ARR from existing customers increasing their spend in the evaluated period.
- Contraction ARR: The loss of ARR from existing customers “downgrading” their spend in the evaluated period.
- Churn ARR: The loss of ARR from customers no longer paying for services.
Why is it important? NDR, which is typically measured monthly, quarterly, or annually (depending on the subscription cycles), is the litmus test for PMF as it shows how fast a company is growing without adding new users. If a business only looks at growth in isolation, it may miss some potential red flags. Are incumbent customers spending the same amount of money or – even worse – reducing their spend and/or no longer paying customers (churning)? Apart from PMF, NDR also helps to signal the company’s ability to increase average revenue per user and thereby the overall pie of the vertical.
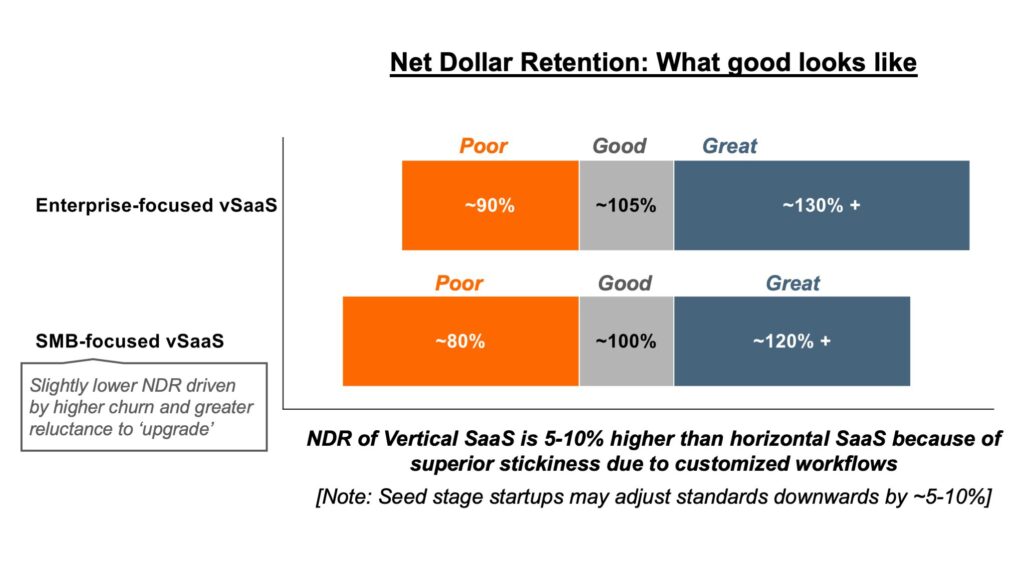
What’s good?: Series A investors typically expect an NDR of 100 percent or higher, indicating strong customer loyalty and revenue expansion within the existing customer base. We also noted that small businesses generally have higher reluctance to upgrade and are more prone to churn than enterprises. Thus, NDRs for software for small businesses are slightly lower than those for vertical enterprise software.
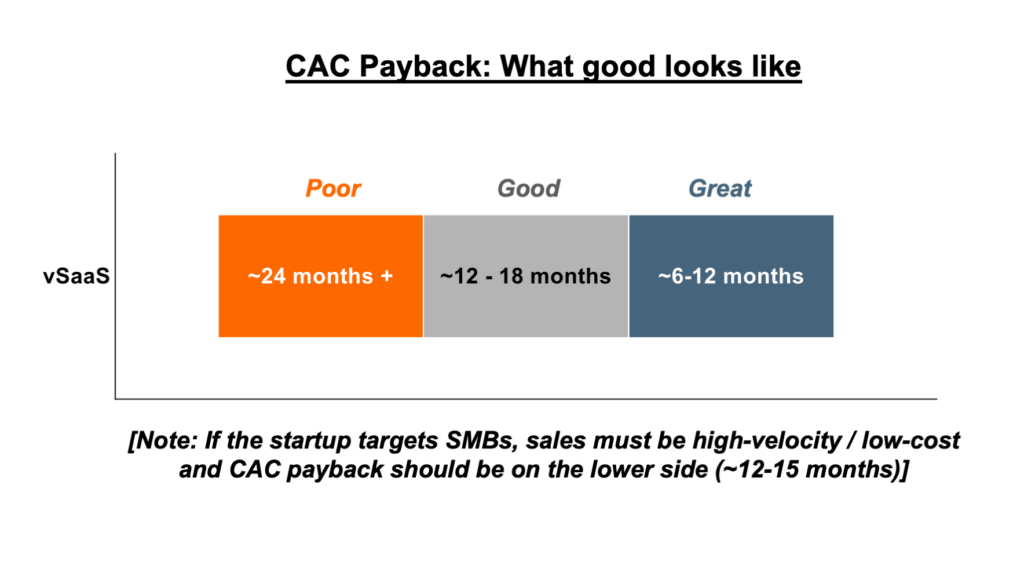
3. Customer Acquisition Cost (CAC) Payback Period
What it is: The CAC Payback Period measures the time it takes for a company to recoup the cost of acquiring a new customer through their contributions to revenue. It’s calculated as:
CAC Payback = Sales & marketing spend of previous period / (new MRR * Gross Margin %) of this period
Why is it important? CAC payback is one-half of the “CAC duo” metric we’re highlighting here – and we isolate it because of its importance in measuring the health of an early-stage startup. CAC payback is a good early measure of a company’s ability to create faster time-to-value (e.g., how soon a customer pays for your service after enrolling) and maintain an efficient go-to-market approach. It can help, for example, identify inefficiencies in customer onboarding that could lead to delays in activation and revenue capture. Its importance continues as the company grows, but often coincides with a more refined LTV/CAC measurement (which we’ll discuss later).
What’s good?: Series A investors typically look for a CAC payback period of 12 to 18 months, indicating efficient customer acquisition and sustainable growth. However, it should be noted that SMB-focused vSaaS should be on the lower end of this scale due to lower CAC and faster GTM motions compared to its enterprise counterpart.
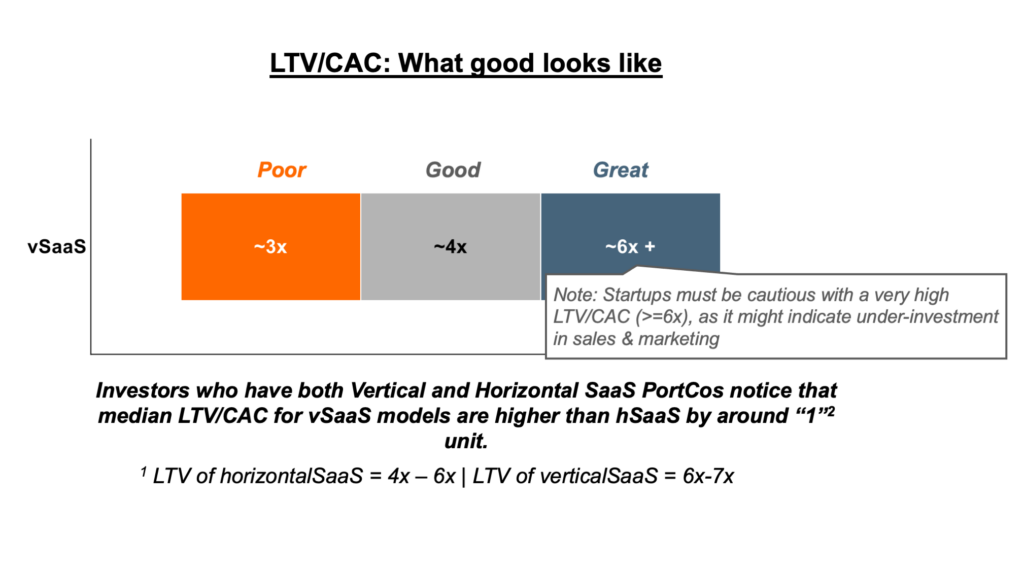
4. Lifetime Value (LTV) to Customer Acquisition Cost (CAC) Ratio
What it is: The LTV to CAC ratio compares the lifetime value of a customer to the cost of acquiring that customer, providing insights into the return on investment from customer acquisition efforts.
LTV is calculated as: (ARPU * average gross margin) / churn rate, while CAC = sales and marketing costs / # customers
Why is it important? This is the other half of the “CAC duo” metric we’re highlighting here, and it’s a more effective way to assess the long-term health of the company’s revenue motion. Ultimately, investors want to ensure that a company’s investment in growth provides outsized returns – and while CAC payback rewards a company for recognizing revenue sooner, LTV/CAC ensures that long-term, that investment in GTM will pay off by revealing the true value potential of the customer (e.g. how “much” a customer is worth).
What’s good? Series A investors typically seek an LTV to CAC ratio of 4x or higher, indicating strong long-term profitability and return on investment. We should note that a high LTV/CAC can signal underinvestment in a company’s sales motion, which can translate to potential side effects – eventual churn, slow growth, unhappy customers, or poor competitive marketing – in the future.
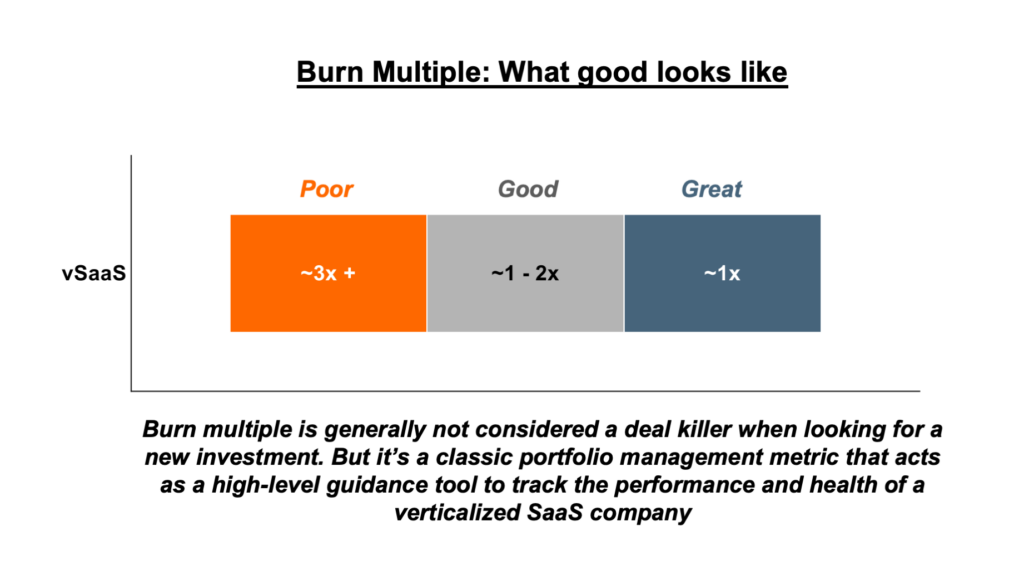
5. Burn Multiple
What it is: Burn multiple measures how much the company is spending to achieve a unit of revenue, and it’s designed to provide insights into the company’s efficiency in managing its expenses. The burn multiple is calculated as:
Burn Multiple = Net Burn (revenue less operating expenses) / net new ARR.
Why is it important? Burn multiple is akin to the temperature gauge on your car’s dashboard: It’s not great at telling you specific things, but can be useful in seeing whether a system is on the verge of broader collapse. Usually, burn multiple is a helpful baseline to understand broader inefficiencies in a company’s operations – and in the case of an early-stage vSaaS company, it can speak volumes as to where their largest expense – the go-to-market function – is in a healthy state.
What’s good? Broadly, we see a 1-2x burn multiple as a good benchmark. However, we should note that a poor burn multiple is not a deal-killer, depending on the circumstances. It’s important to take the metric in context of other operating metrics we mentioned here.
With these metrics and benchmarks, we’ve laid the foundations for what a verticalized SaaS startup can set as its “north star” metrics for success – and what expectations investors will have of these models. Read more in part two of this series, where we shift into execution mode: discussing the tactical steps a vSaaS company can use to affect these metrics – and, in particular, where embedded finance can be a crucial tool in growing new revenue, building stickiness in your current customer base, and building lasting value.
Explore More